Many things have happened during this year related to Chemistry, and it is always difficult to summarize them in only one article, but I will definitely do my best to make an analysis and report of the top chemistry facts and stories of year 2014: The Ebola crisis, the balance between scientific publications and investment, impressive advances in organic chemistry, more and more graphene, etc.
Most Popular Stories in Chemistry Research in 2014
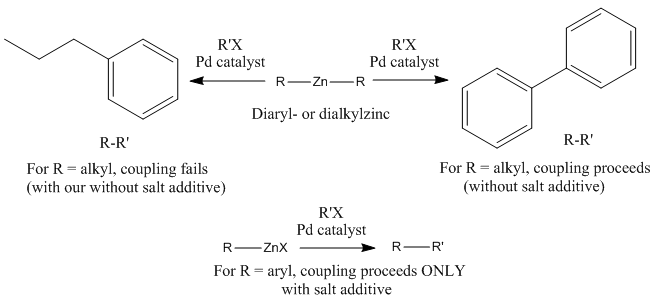
Adding Salt to Improve the Taste of Negishi cross-couplings:
Negishi (who won the Nobel Prize in Chemistry) Cross-Coupling is a very famous organic reaction used from its discovery, in 1977. The reaction consists on the formation of a new C-C bond between one aryl or alkyl halide and an R group (alkyl or aryl) which is transferred from a organometallic Zinc reagent, (which was usually a compound with a general formula R-Zn-R) through a transmetallation process using a palladium compound as a catalyst.
The addition of salts like ZnCl2 or LiCl was studied and it was concluded that it successfully improves the reaction in many cases and it makes it possible with reactants which showed no reaction at all without the salt addition.
Diarylzincs were known to readily transfer to palladium in solvents like THF without needing salt present, but for example, arylzinc halides (ArZnX) will not couple without salt, but the reaction proceeds with salt additive. Also the polarity of the solvent employed in the reaction has a determinant role on the activation of the zinc species. In fact, the addition of the salt affects the reaction augmenting the polarity of the solvent.
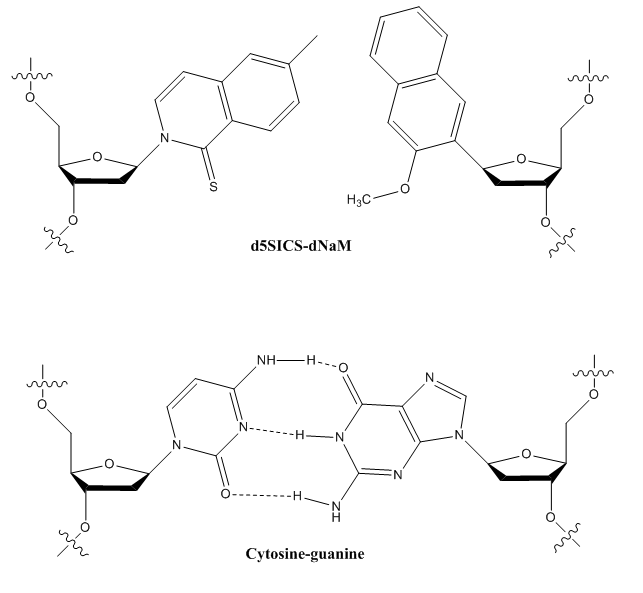
Related to biochemistry and synthetic biology, some more stories in chemistry: it was found that some bacterial cells happen to accept a new kind of expanded genetic code. Surprisingly, these living cells accepted DNA that was put into them, which was formed from three base pairs, not only A-T and G-C anymore, we have two additional ones, keep reading to find out more!
Usually DNA only uses two bases, since life evolved to this characteristic and worked well for all the known living bodies: Pairing guanine and cytosine, and thymine and adenine. But in 2014, Floyd Romesberg (Scripps Research, in San Diego California) and his team successfully put DNA with three pair of bases into living cells. The two new pair of bases were called dNaM and d5SICS and whereas C-G and T-A pair due to hydrogen bonding, these brand new DNA bases bond together mostly due to hydrophobic interactions.
What does that mean for science? Well, if with 4 bases 64 codons and then proteins with 20 amino acids could be formed, this new expanded DNA could end up with the discovery of a possible future expanded RNA with 6 bases, through 216, we could be talking about future proteins based in up to 172 different amino acids. This would be a huge advance on the possibilities of genetic code studies and applications.
Finally, one of the most popular research activities, this time related to materials chemistry, was the preparation of high purity single-walled nanotubes, which were grown from seeds.
Scientists had created two new routes to the preparation of these nanomaterials with its typical strength, conductivity and flexibility, single-walled carbon nanotubes (also known as SWNTs). So far, most methods produced complex mixtures of different sized nanotubes and variations in chirality or diameter, which always was an important problem.
The group of Yan Li provided a method to produce single chiral nanotubes with a purity of 92% (being 55% the maximum achieved so far). In addition, Roman Fasel and his coworkers (at the Max Planck Institute for Solid State Research, Germany) made one only type of single-wall nanotubes from a PAH (polycyclic aromatic hydrocarbon) as seed molecule. Now let’s take a look at the most popular chemistry related stories of 2014.
Most Popular Stories in Chemistry of 2014
During the course of this year, one of the most popular crises was that related to the Ebola virus. Many advances in drug development towards the cure for this disease were made in 2014. Efforts were made all around the world; vaccines researched and developed, tested and started to be deployed in the most affected territories.
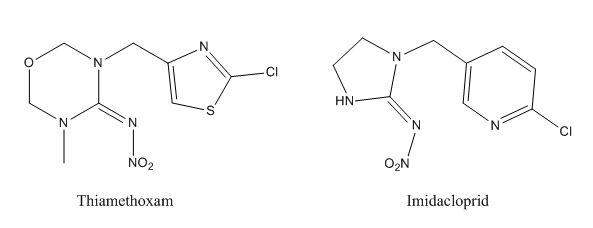
Necrotinoids are insecticides (neuro-active compounds with an activity similar to the one of nicotine) attracted a good amount of attention due to the potential harm that they represent to insect like honeybees and other kind of animals that move pollen between flowers. EPA made many analysis and changes on regulations were done. In fact, these compounds, like thiamethoxam, have caused an estimated $400 million in damages in the last decade.
EPA (Environmental Protection Agency) made moves to reduce levels of CO2 emissions. Two new regulatory laws were proposed during this last year in order to make the rate of CO2 emissions drop. The most remarkable data is that following these new plans, the emissions of carbon dioxide from coal-fired industries would go down from 2005 to 2030 in a 30%, which is a fairly good number. The US was the most important producer of carbon dioxide (and other kinds of greenhouse gases), so the concern of the government about this issue is a very nice step forward.
An operation carried out by US engineers successfully destroyed deadly Syria’s chemical weapons. Portable systems of hydrolysis were used to neutralize these weapons, which are about 580 tons of methylphosphonyl difluoride and about 20 tons of a blistering agent, sulfur mustard.
We could continue with more stories in chemistry, but these were some of the most relevant ones that we found interesting, and I wanted to share with you. Now we will continue with some numbers.
Year 2014 in numbers
We have done some research and data treatment which I summarized in a few graphics and the first of them is the one that follows, and it gives us an idea of the ratio between the published papers in the 40 countries with more publications and the number of researchers in the country.
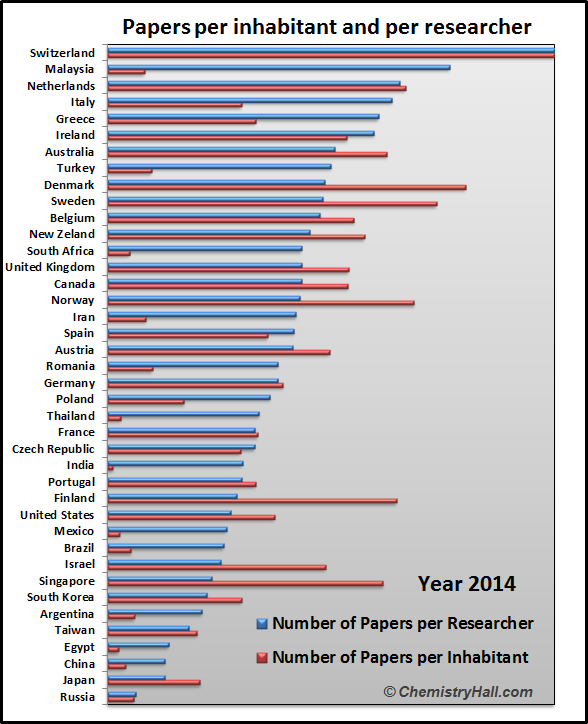
Basically what we have done in this graphic is take the data for the number of papers published during 2014 and divide it by the number of active researchers of each country, and represent it with blue bars. For the red bars, the number of publications was divided by the population of each country. Both ratios are normalized to be able to show the comparison (every value divided by the highest value of each series). All the data can be found in the reference page, but you can check now if you want the data for the number of researchers in the World Bank.
Since the data was normalized, it we will provide some numbers to these ratios.
The highest value for the ratio number of papers over number of researchers was for Switzerland, with a value of 0.76, so there is no country in the world with a ratio higher than one published paper per researcher. Switzerland is a total winner, since on the second place is found Malaysia, but with a value of 0.58 publications per researcher, which is followed closely by Netherlands (0.49), Italy (0.48) and Greece (0.46).
The country where this ratio is lowest is Russia, with the impressive value of only 0.05 papers per researcher, followed by Japan and China (both 0.10).
In the middle are located countries like South Korea (0.17), the United States (0.21) Germany (0.29), the United Kingdom (0.33) and Spain (0.32).
Of course this is not a good indicator of the quality of the scientific publications, just a matter of numbers, but it is good overall amount of data to compare.
This analysis is based on the scientific paper trail done by Nature [4] which based on Web of Science data that presented the number of published papers in this years (by the end of October): The most important numbers go for the US, with 310,206 published papers, followed by Chine (142,645 papers) the United Kingdom (90,018) and Germany (82,550).
Now if you take into account the ratio number of papers over population of each country, you can check that for some of the territories the normalized value is quite similar than the one for the ratio respect to researches (for examples, Switzerland still clearly is the absolute winner), for other countries like Malaysia (second position in the research ratio), the rate drops a lot. This represent a less overall dedication to research of the population, and also makes clear that if those countries with huge differences between the two ratios would have produce a very good amount of scientific literature only if they had invested more on science.
Countries in which the case is the opposite, like the United States, Denmark or Finland show a stronger support for scientific material production and research above other things. This can be also becomes clear if one checks the percentage of the money each of those countries invest on research and development (R&D).
In regard to money investment, we also studied the money spent by each country on research. Based on the money invested in R&D by each country during year 2014 a ratio was obtained for the money spent per paper produced and another ratio for money spent per active researcher.
As a first comparative, the following normalized graphic was created:
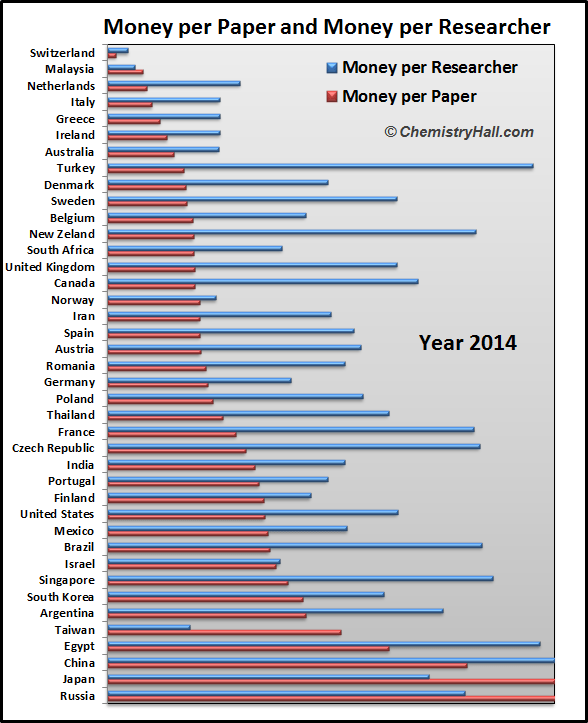
The most expensive papers were published on Russia, Japan and China, and the cheapest papers were produced on Switzerland, Malaysia and Netherlands. Interestingly enough, the cheapest papers are produced in the countries were the highest ratios of produced papers per number of researchers are found. The opposite occurs for the most expensive papers. This can be taken as an indicator of the research money being well invested, and producing good results. This is a point that should encourage countries to invest more money on research and development.
Finally, a third graphic was drawn to compare absolute values for this data:
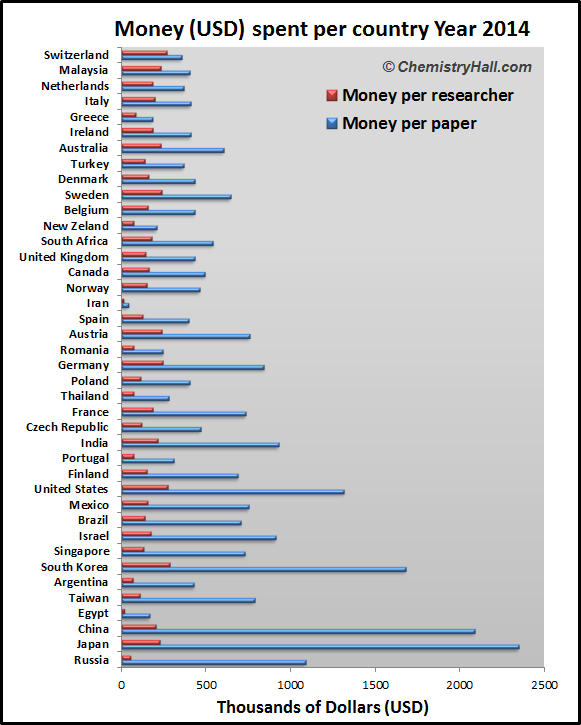
This is the amount of money in USD that each country spent per researcher and per published paper. For Switzerland, each $40,200 was translated into a published paper, and in contrast, for Japan, an investment of $1,313,000 was made for each publication.
In regards to the money that a country had to spend by researcher last year was less variable than for publications, but still there are huge differences, for example, Egypt spent $17.100 only per researcher last year, and in contrast, Switzerland spent up to $270,000 for each active researcher.
This analysis of the economy factors is not as accurate as I would like it to be, since the way of investing money of each country is quite different, but remember, this is just a model.
Finally we want to end the article (and the year) with some numbers facts (many of these stories in chemistry being kind of funny) and data collected related to science in general during this old year 2014, the new year 2015 and compared with other time periods – Note that many of them, especially the ones referred to 2015 are estimated extrapolations, and there is not much reliability on an extrapolated result, it only is an orientation-
- Global Investments in research and development has grown by about 7% per year for more than a decade: $760 billion in 2000, $954 billion in 2005, $1.3 trillion in 2010 and this year (2015) should be approximately equal to $1.9 trillion (the seam than the gross domestic product of India).
- About 1.2 million patents granted and 2.6 million patents filed so far.
- About 26 billion hours dedicated to research will take place in 2015, thanks to 10 million researchers who average 50-hours working weeks. Those 26 billion hours equal 2.9 million years, (the difference of time between today and the days of Autralopithecus africanus).
- About 260,000 new PhD holders are expected to appear on 2015, more than twice the number in 2002 (125,000 new PhD holders).
- About 1.5 trillion bases are filed in GenBank so far.
- About 920,000 scientific publications exist so far. (From which only a tiny fraction, approximately 500 publications, are ever retracted). This number increases about 3% a year.
- About 1 billion of cups of coffee will be consumed by scientists in 2015. This is a number that could be enough to give every European Union inhabitant two cups of this essential stimulant.
- About 230,000 cookies will be consumed by the researchers in Antartica’s McMurdo Station in 2015, which makes a rate of 4,500 cookies devoured per week.
Hope you have enjoyed the read! There is nothing left to say more than wishing you a Happy New 2015, and just asking you for your opinions, suggesions or any kind of feedback through the comments.
Want to take a look at some other cool chemistry blogs? Check out this index.
Subscribe to our site and share this article with your colleagues, friends and social media! If you are hungry for some more chemistry stories, check out our post about the discovery and synthesis of LSD.


I’ve always thought that my colleagues and I consumed a very huge amount of coffee at work, but it seems that there is a trend between us scientists.
Very nice read, I’m bookmarking the blog and subscribing to it, looking forward to all you want to tell us 😀
Regards
Curious data, isn’t it?
I love that you enjoyed the reading! I will surely be happy to write more if people like you are interested!
Thanks
As a reseacher from Russia I can say there is something wrong with the data (at least for our country). The most common amount of funding which a research group can take for a year is approx 6500 $. There is no way one would have ~200 grants for one paper.